We believe that making videos for nonprofits is both an art and a science.
While much has been written about the art of creating great videos, there’s very little about the science. That’s why we created the Nonprofit Video Index™.
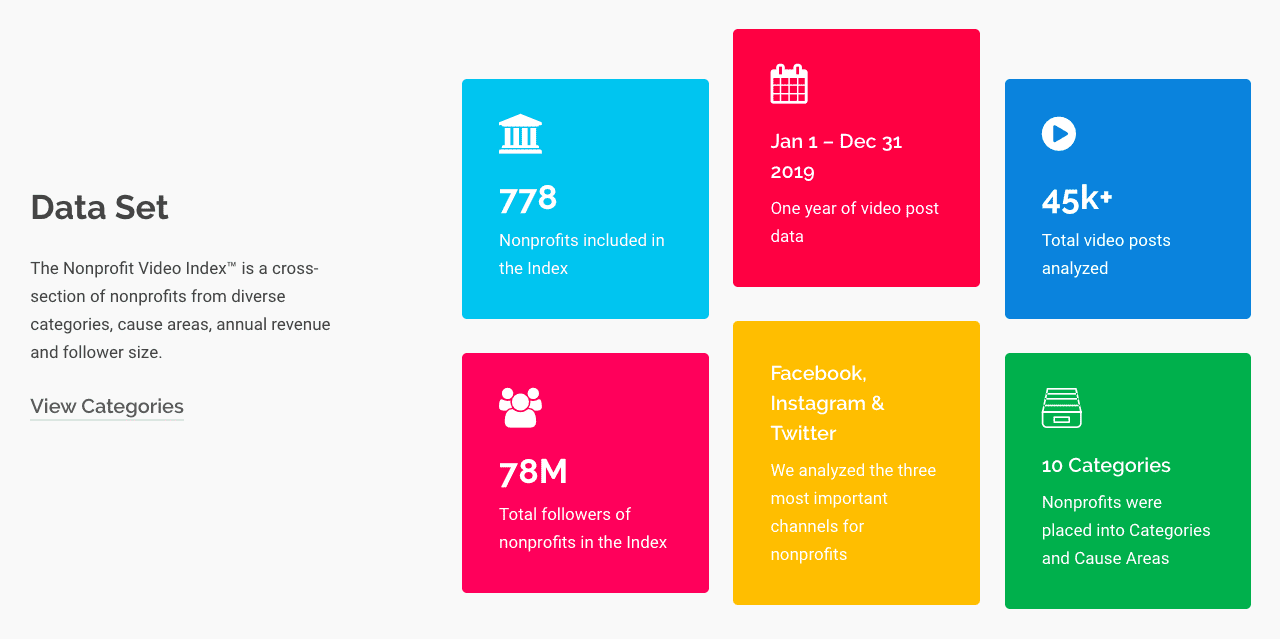
The Nonprofit Video Index™ is a landmark study of how nonprofits use video on social media. We analyzed one year of video posts on Facebook, Twitter and Instagram for 778 nonprofits across the social sector to identify benchmarks, best practices, and insights for creating better videos.
Screen grabs from the Nonprofit Video Index™.
”Far too often, we rely on gut instinct when making decisions in the nonprofit sector. With the Nonprofit Video Index™, the team at Tectonic Video is providing organizations everywhere with actionable intelligence they can use to drive engagement and fundraising—something that is more important now than ever.
Andrew MeansFounder of Data Analysts for Social Good
After spending the better part of a year analyzing thousands of data points, we’re eager to share what we’ve learned. Here are a few of our key findings.
1. Facebook Still Reigns Supreme, but Instagram Is Growing Fast
Facebook still dominates as the most powerful channel for nonprofit video. Index nonprofits report a total of 46 million page likes on Facebook, compared to 21 million Twitter followers and 11 million Instagram followers. But Instagram is quickly catching up.
Nonprofit audience growth on Instagram averaged 30%, compared to 8% on Facebook and 5% on Twitter. Engagement levels are also highest on Instagram, where the average engagement rate per video post is more than three times higher than on Facebook and nearly seven times higher than on Twitter.
2. Some Content Is Inherently More Engaging
Do some nonprofits really have an easier time creating highly engaging videos? It turns out that the answer is yes. Videos about animals, kids and cuteness ranked top for engagement in the Index. Baby animals proved particularly engaging.
In second place were emotional reactions recorded in real-time—reunions, celebrations, and other moments that tug at the heartstrings. Third place went to political or hot-button topics with calls to action on legislation or campaigns like sustainability and reproductive rights.
3. Production Value Doesn’t Drive Engagement
We also wanted to know if videos with high production value— professional cameras, lighting equipment, sound design, and graphics—were more engaging on social media videos. In reality, the opposite is true.
Most of the Top 100 Most Engaging Nonprofit Videos in the Index didn’t have high production value, using consumer video cameras and even smartphone cameras instead. This is good news for budget-constrained nonprofits who know that professional tools aren’t required to create highly engaging videos.
4. Audience Size Comes from Post Frequency and Engagement, Not Budget
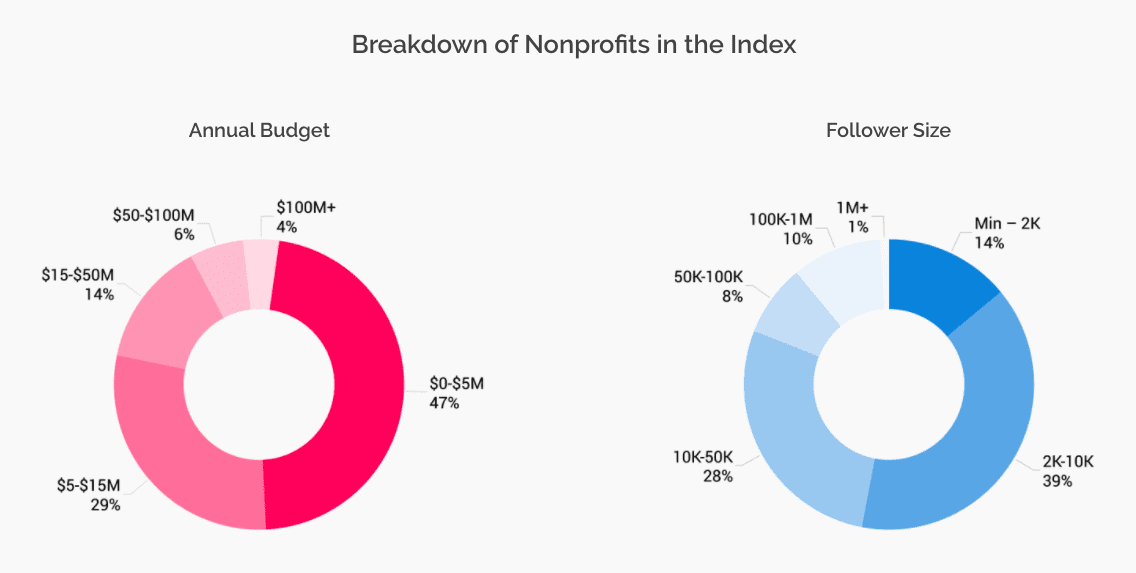
We found that nonprofits with large budgets—$50 million to $100 million—were no more likely to have large audiences than their smaller counterparts. Post frequency and engagement rates, on the other hand, make a big difference.
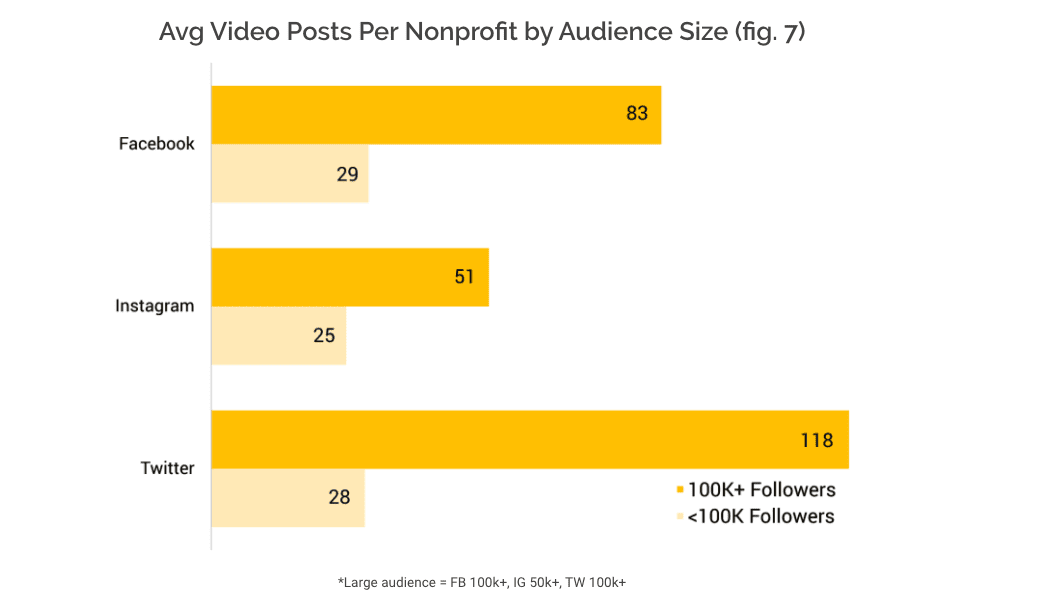
Organizations with large audiences—100,000 or more—post videos nearly three times as often on Facebook, twice as often on Instagram, and nearly four times as often on Twitter.


